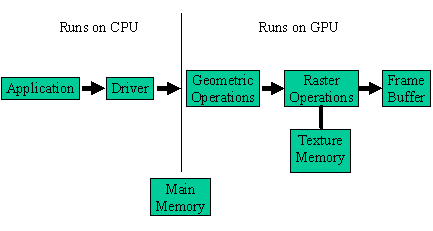
The graphics system generates images through a pipelined sequence of operations. A pipeline runs only as fast as its slowest stage. The slowest stage is often called the pipeline bottleneck. A single graphic primitive (for example, a triangle) has a single graphic pipeline bottleneck. However, the bottleneck may change when rendering a graphic frame that contains multiple primitives. For example, if the application first renders a group of lines and afterwards a group of lit and shaded triangles, we can expect the bottleneck to change.
The first step in optimizing graphical applications performance is to identify the slowest graphics pipeline stage. gDEBugger provides tools that enable you to identify graphic pipeline bottlenecks.
The OpenGL pipeline is an abstraction of the graphics system pipeline.

Some of the pipeline stages are executed on the CPU; other stages are executed on the GPU. Operations executed on top of the GPU may be executed in parallel.
The process for optimizing graphical application performance contains the following stages:
Steps 1 and 2 should be repeated until the desired performance level is reached.
See also:
Performance Analysis toolbar
Performance Graph view
Performance Dashboard view